Trade Openness and Entrepreneurship in Africa
Eric Boccaccio and Jhaelle Payne
3/30/21
Abstract
This study examines the correlation
between Trade Openness and Entrepreneurship in 5 African nations: Angola,
Egypt, Madagascar, Morocco, and Sudan. While previous research has shown a
positive correlation between these factors in other regions (Bayar et al. 2018),
this is the first study that exclusively focuses on low to medium-low income African countries. Due to limitations in data
availability, the design of this study is cross-sectional, meaning that it only
examines data for one time point, 2018.
Using a linear regression model, we found
that—holding
poverty, average years of education, and law and order constant—a 10%
increase in trade openness will lead to a 5.75% increase in
entrepreneurship on average. Although we found a positive correlation, there
is not enough data available to reject the null hypothesis that no correlation
exists between these two factors in Africa.
Future study requires more abundant and frequent regional
entrepreneurship data, as more data points are needed to judge whether or not the correlation found in this study is
significant.
Keywords: Entrepreneurship, Africa,
Trade, Trade Openness
Introduction
This study analyzes the correlation
between trade openness and entrepreneurship in 5 African nations: Angola,
Egypt, Madagascar, Morocco, and Sudan.
In recent years, there has been an increase in
cooperative trade deals between African and non-African countries. Often, these
deals are made by African leaders with the intent to stimulate economic growth.
To citizens, the commonly cited justification for trade openness is that a
better economy creates a more upwardly mobile populace.
To test this theory, we’ve
decided to focus on one method of attaining upward mobility, entrepreneurship.
We aim to examine how trade openness correlates with entrepreneurship using
data from 5 African nations. We control for education, strength of
governance, and poverty levels.
Literature Review
The Relationship
Between Trade Openness and Entrepreneurship
This study analyzes the correlation between trade openness and
entrepreneurship in 5 African nations. While past scholarship has shown
these two factors to be positively correlated, the African region has not been
a focus of previous work. Bayar et al. (2018) studied 15
countries worldwide from 2001-2015 and found that “banking
sector and capital market development, FDI inflows, and trade openness affect
the total early-stage entrepreneurial activity positively.”
Notably, of the 15
countries that Bayar et al. considered, only one (South Africa) was located in Africa. The study also was
exclusively limited to upper-middle and high income countries,
whereas all 5 countries in this study were classified as either
lower-middle or low income at the time of data collection.
Importance of
Studying Entrepreneurship
Entrepreneurship has long been thought to be a key method of
attaining upward socioeconomic mobility. While there are few studies examining
the relationship between entrepreneurship and socioeconomic development in
Africa (Nafukho and Helen Muyia 2010), studies in Latin America have shown
that “entrepreneurship is a channel of intergenerational
mobility,” with most of this mobility being upward (Castellani and Lora
2014).
Entrepreneurship has
also been shown to drive overall economic growth in Africa. Adusei (2016) compared results from 12 African countries
and found that “entrepreneurship positively explains the variations in the
growth of the study countries.” He goes on to contend
that “entrepreneurship in developing economies including Africa, even if
replicative, is instrumental to economic growth.”
Why focus on
Africa?
Africa is an important region to study in this context due to its
recent rapid increase in entrepreneurship levels (Singh and Belwal 2008). This increase is especially
intriguing given Africa’s colonial history. By the end of the
European imperial era, the region had been stripped
of much of its culture, resources, and governmental structures
(Halkias, et al. 2011).
After
the imperial powers exited the region, Africans were forced to
rebuild their societies with very little resources. Some African countries
have thrived, while others have yet to fully recover. Therefore, it is
important to understand what factors contribute to African
economic and socioeconomic growth. In this study, we examine the
relationship between two known predictors of economic growth: how
trade openness correlates with entrepreneurship.
Trade Openness
In the past, trade openness has been shown to correlate with a
variety of factors. Le Goff and Singh (2013) studied the relationship between
trade openness and poverty in a panel of 30 African countries from 1981 to
2010. After controlling for factors such as education and strength of
governance, they found that “trade openness tends to reduce poverty in
[African] countries where financial sectors are deep, education levels high and
governance strong.” This study and Le Goff and Singh’s work use
similar experimental methodology and control factors.
To test the impact of trade openness on economic growth in
Africa, Brueckner and Lederman (2015) studied 41
African nations and found that “trade openness has a significant positive
effect on economic growth.” Controls included GDP growth of trading
partners, civil conflict, and even amount of rainfall.
Methodology
This
study is designed to determine whether a correlation exists between trade
openness and entrepreneurship levels in 5 African nations: Angola, Egypt,
Madagascar, Morocco, and Sudan. The study controls for poverty, education, and
strength of governance.
Data
Table 1 — Variable Definition and
Sources
|
Variables |
Description |
Data Sources |
|
Trade Openness Independent
Variable |
Sum
of imports and exports as a share of GPD |
World
Bank Financial Statistics |
|
Entrepreneurship Dependent
Variable |
Proportion
of the population actively engaged in starting or running a new
business |
Global
Entrepreneurship Monitor (GEM) |
|
Poverty |
Percentage
of the population living below the $1.90/day poverty line |
Euromonitor
International Passport: Economies and Consumers |
|
Law and Order (Strength of Governance) |
Strength
and impartiality of the legal system, and popular observance of the law. Values
range from 0 to 6, with a higher figure indicating a
higher quality and more enforced legal system |
International
Country Risk Guide (ICRG) |
|
Education |
Population-weighted average
years of formal education |
Global
Health Data Exchange (GHDE) |
Data Sources:
All
data was collected from established datasets. Data on trade openness was
collected from the World Bank. Entrepreneurship data comes from the Global
Entrepreneurship Monitor (GEM). Data on education was collected from
the Global Health Data Exchange (GHDE). To measure quality of governance,
we used a law-and-order indicator from the International Country Risk Guide
(ICRG). Poverty rates were sourced from Euromonitor International’s Economies
and Consumers dataset. Raw data can be found in the appendix of
this report.
Measurement Procedures:
Trade Openness (independent
variable/input):
In
economics, there are two accepted ways to measure trade openness. The first
method is policy based; a measure of the openness of a particular country’s
trade policy. The second method is outcome-based, which boils down to the
amount of trade taking place across a given country’s borders (Spilimbergo et al. 1999). For
the purpose of this study, we found an outcome-based measurement to
be the most practical option. Not only is outcome data easier to obtain, it also provides a more complete view of each country’s
total level of trade in the market.
The most common outcome-based measurement of trade openness
is the sum of imports and exports divided by a country’s GDP, and this is the
method used here. Data is provided by the World Bank. Because the latest
available entrepreneurship data for the selected countries is from 2018, trade
openness data will also be taken from that year.
Entrepreneurship (dependent variable/output):
The
Global Entrepreneurship Monitor (GEM) measures entrepreneurship levels through
use of survey data.
The
GEM bases results on two surveys, the Adult Population Survey (APS) and the
National Expert Survey (NES). The APS has a sample size of at least 2,000
working age adults in each country and asks about “entrepreneurial
activities, attitudes, motivations and ambitions” (Bosma et
al. 2020). The NES samples responses from at least 36 national experts in
each country who provide insight on government policy, infrastructure,
availability of entrepreneurial education, and more.
Based
on the survey responses, a Total Early-Stage Entrepreneurial Activity (TEA)
index is created. Each country is assigned a TEA value for a given year. The
TEA is defined as “the proportion of the working-age adult population actively
engaged in starting or running a new business.” In this case, any business
younger than 42 months is counted as new.
Because the 2019 GEM report includes fewer African
countries, data is sourced from the 2018 report.
Control
Variables:
To attempt to isolate the relationship between our two main
variables, we have chosen to control for 3 additional factors.
Poverty is measured using the poverty
headcount index, which is the percentage of a country’s population that lives
below a set poverty line. The current International Poverty Line is $1.90 USD
per day accounting for differences in purchasing power between
currencies.
Educational attainment is
measured by average years of formal education among the
country’s populace and is population weighted.
Strength of governance takes into account the strength and impartiality of the
legal system, and popular observance of the law. The ICRG uses
quantitative analysis, forecasting, and data series to measure political risk
by country.
These 5 data sources pay particular attention to
their methods for obtaining data because developing countries lack statistical
infrastructure, which can lead to inaccurate results.
Statistical Method
To estimate the relationship between entrepreneurship level
and trade openness, all other factors in the compiled dataset were controlled.
To achieve this, linear regression was used to measure the exact effect a 10%
increase in trade openness has on entrepreneurship levels, given all other
variables are held constant. Then, a scatter plot displayed the residual values
compared to the fitted values, to understand the accuracy of the model.
Results
Figure 1
Summary Statistics of
Numerical Variables
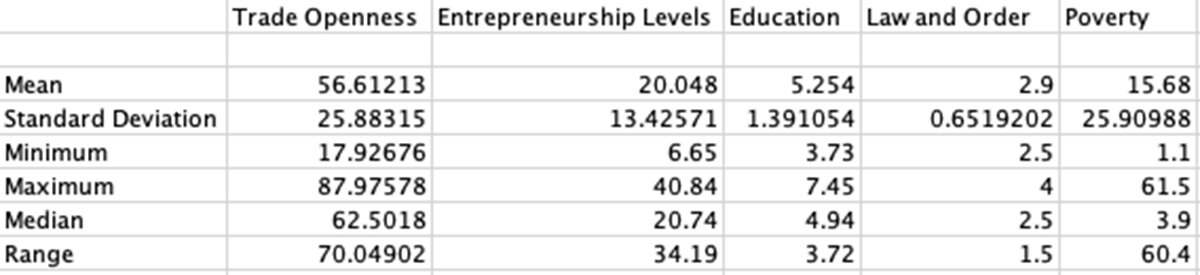
Figure 1 displays the mean, standard
deviation, minimum, maximum, median and range of the numerical variables. The
high standard deviation in Trade Openness, Entrepreneurship Levels, and Poverty
indicates that the data points are more spread out. Also, in Trade Openness,
Entrepreneurship, and Poverty, the range values are particularly high which
highlights the vast political, economic, and social differences between the
observed countries.
Figure 2
The Correlation
Between Entrepreneurship Levels and Trade Openness
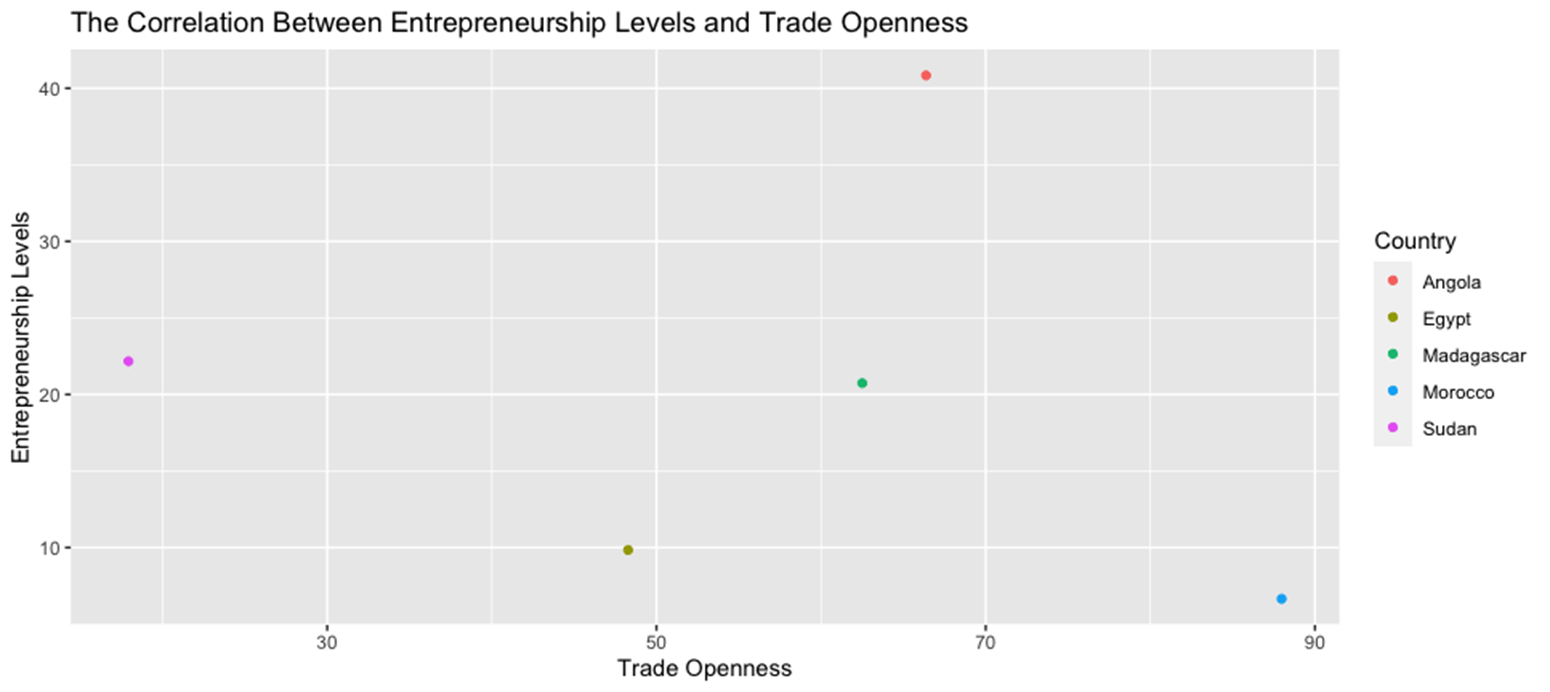
Figure 2 displays a
visual representation of the correlation between Trade Openness and
Entrepreneurship by Country. Given that there is not a linear trend between the
two variables, when performing linear regression, a logarithmic transformation
will have to be used on the data values.
Figure 3
The Predicted Percent
Change in Entrepreneurship Level for A 10% Increase in Each Variable, Holding
the Other Variables Constant
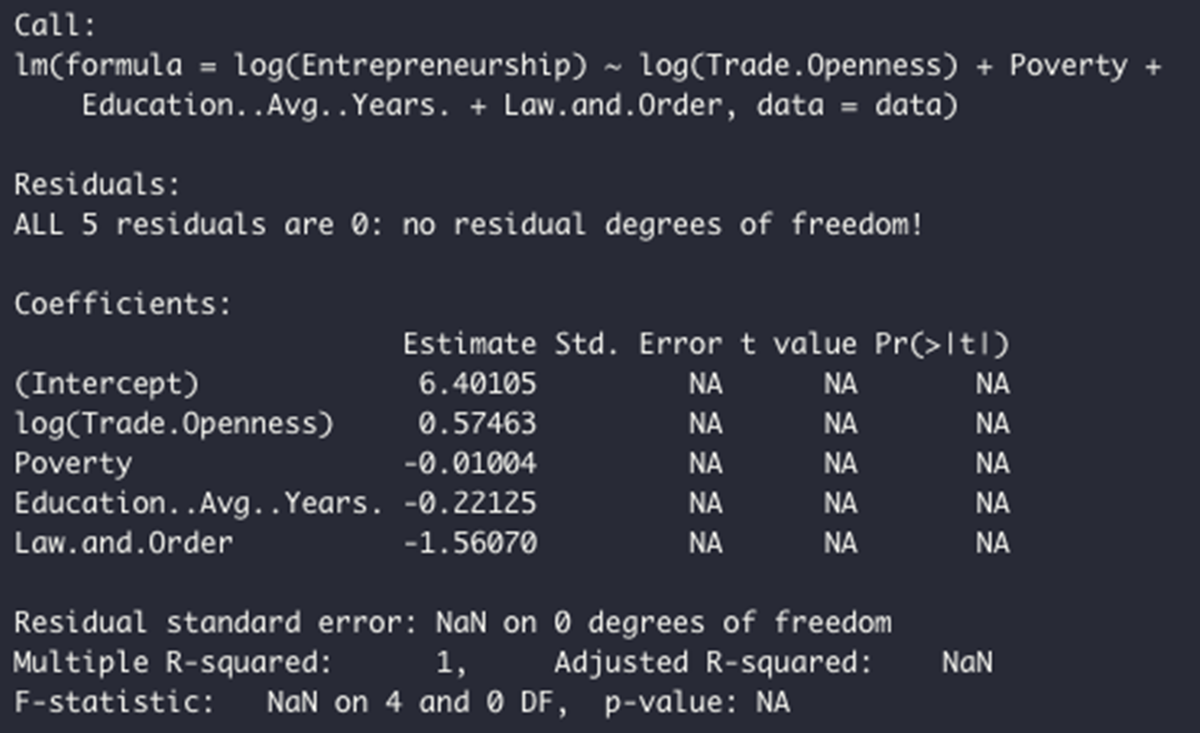
In Figure 3, our final
model is as follows:
log(Entrepreneurship) =
.575*log(Trade Openness) + -.01*Poverty + -.22*Average Years of Education +
-1.56*Law and Order.
Holding poverty, average years of education, and law and order
constant, a 10% increase in trade openness will lead to a 5.75% increase in
entrepreneurship on average. This exhibits a positive correlation between trade
openness and entrepreneurship levels within Angola, Egypt, Madagascar, Morocco,
and Sudan. Logarithmic transformation was used because the data values are
nonlinear. A logarithmic transformation can transform a skewed dataset into a
normalized one, where the shape of the values become closer to a normally
shaped bell curve. Only the log of the values shift, not the raw data. This
transformation also allows the model to produce the smallest error possible
when predicting values while preventing overfitting.
Figure 4
The Residual Values
Compared to the Fitted Values
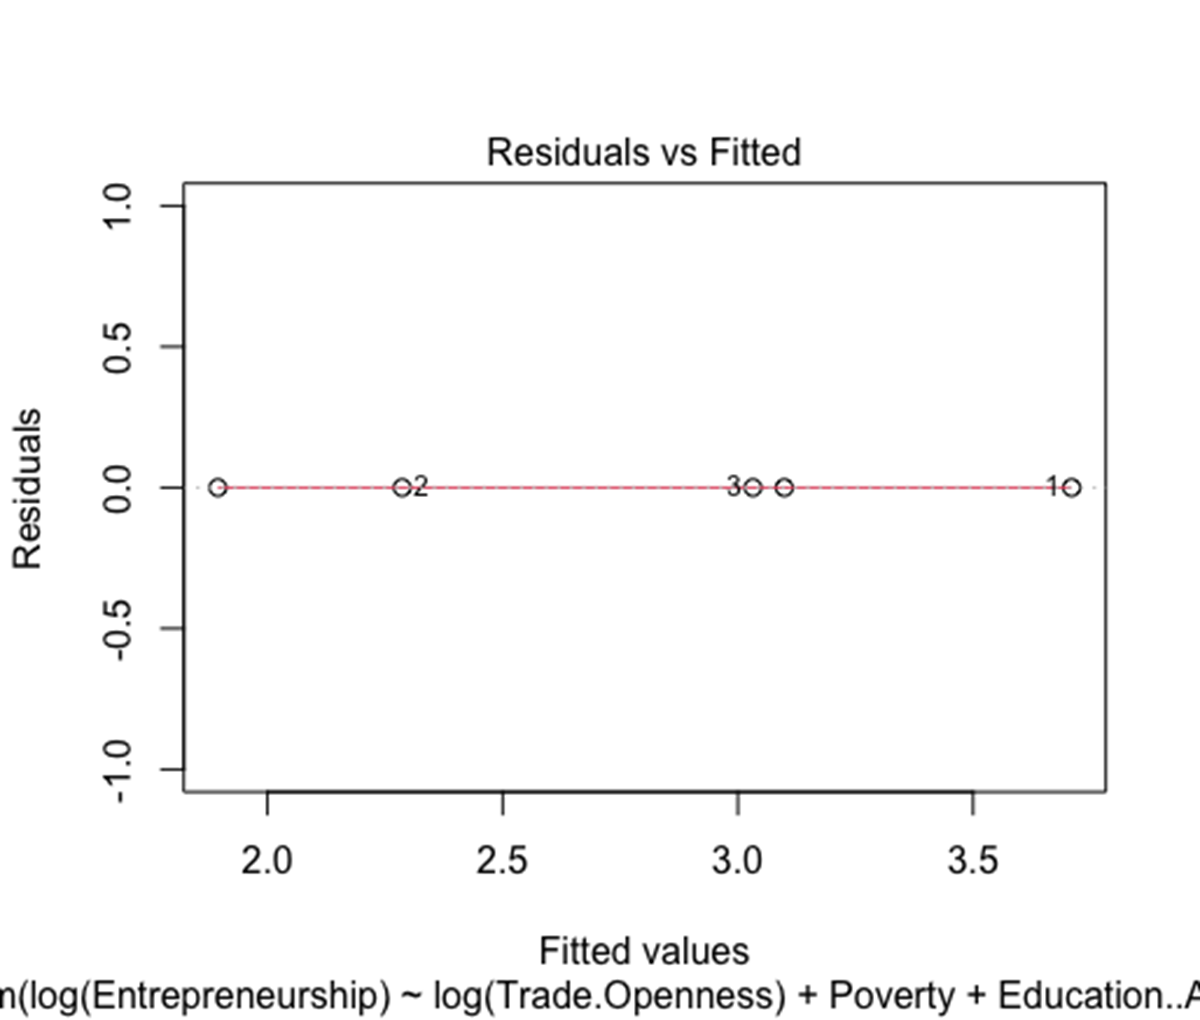
In Figure 4, the
scatter plot demonstrates the accuracy of the predicted values. In which, the
model was able to predict the values with high accuracy. This is shown through
the lack of outliers and its residual value of 0, meaning there is not a
numerical difference between the fitted and predictor values.
Discussion and Limitations
Variables
Variables were
chosen based on Le Goff and Singh’s (2013) work on the correlation between
trade openness and poverty. Le Goff and Singh found that “trade openness tends
to reduce poverty in [African] countries where financial sectors are deep,
education levels high and governance strong.” Therefore, this study controls
for poverty levels, education levels, and strength of
governance (law/order). Because our instrument only allows for three
control factors, we were unable to include financial sector
strength as a control.
Data
There are a few
limitations stemming from the data used in this study, mostly having
to do with age and availability.
Total
Early-stage Entrepreneurial Activity
To create a valid cross-section, we needed to make sure that datapoints
for each country were taken from the same year. While the Global
Entrepreneurship Monitor does contain entrepreneurial
activity data for 20 African countries, not every country is
measured annually. In the past 5 years, the year containing the
highest concentration of data from African countries in a single timepoint
was 2018; with data from Angola, Egypt, Madagascar, Morocco, and
Sudan. Therefore, our cross-section was limited to a maximum of 5
countries.
The lack of
consistent annual African entrepreneurship data is also the
reason why a time-based model, such as the one used by Bayar et al.
(2018), was unfeasible in this study.
Average Years of
Education
Although every other factor considered in this study uses
data taken in 2018, the Global Health Data Exchange only
has relevant education data available up to
2015. Therefore, the education data used in our model is
about three years older than the rest of the
data. While we cannot ensure that this data remains accurate in
2018, we can test the degree to which education
data varies in the time leading up to
2015. In the three-year period from 2012-2015, mean
years of education for our 5 countries deviates by about 0.13
years on average.
If this
trend continued for the following three years, we can assume that the mean years of education
in 2018 should be roughly similar to 2015 plus or minus a few
months. This relatively small degree of uncertainty is unlikely to have
changed our results significantly.
Percent
of Population Living Below International Poverty Line ($1.90 a Day)
The poverty data
used in this study is 2018 estimates from Euromonitor
International’s Passport. Euromonitor estimates this data using
previous poverty estimates released by the World Bank. The
methodology that Euromonitor uses to calculate these yearly
estimates, however, is unclear. This being said,
Euromonitor International is a trusted, well established
market research corporation.
Model/Research
Design
This study is also limited in the sense that it provides a cross
section of variables at only one time point, 2018. Because we were unable to
model these variables over time, it is possible that the correlation we found
between entrepreneurship and trade openness in 2018 doesn’t
exist at other time points. This being said, we estimate the
probability of 2018 being an outlier to be small, especially given
that Bayar et al. (2018) found a similar relationship between these two
variables worldwide in a study spanning 14 years. Given the differences between
the countries studied here and the ones included in the work of Bayar et al.,
however, it is still worth noting the limitations of having used a
cross-sectional method.
Also,
through performing a backwards stepwise regression, we found that our Law and Order variable would have been a better indicator of
Entrepreneurship Level. A backwards stepwise regression starts with a model
containing every variable, then at each step it removes a variable to find a
regression model with the least number of variables needed to explain the data.
Figure 5
Training
the Model
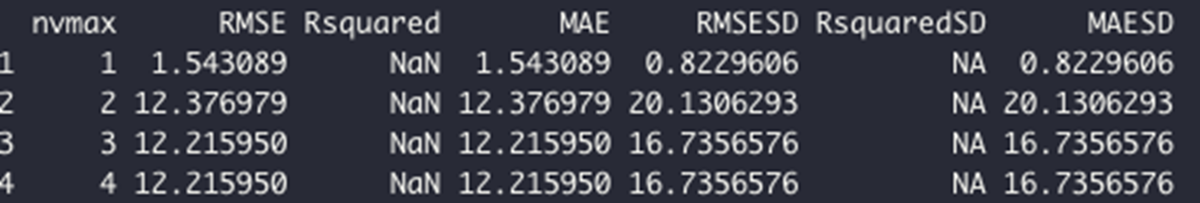
Figure
5 demonstrates the backwards stepwise regression testing a certain number of
variables at a time in the model. The column “nvmax”
displays that number of variables. The Root Mean Square Error (RMSE) and Mean
Absolute Error (MAE) demonstrates that one variable in the model will best
explain the data. Specifically, the lower RMSE and MAE value is, the lower the
bias. This will ensure that our model is as accurate as possible because lower
bias is an indication of higher accuracy.
Figure 6
The
Best Set of Variables for the Model
![]()
After
training on the data, figure 6 demonstrates which variables will best explain
the data. In which only Law and Order was selected by placing an asterisk under
the variable.
Significance,
Future Study, Policy Recommendations
Because of our limited number of data points, it’s impossible to reject the null hypothesis that
trade openness has no effect on
entrepreneurship in Africa. Therefore, the initial results found
here need to be validated by further study. This being
said, our results do show trade openness and
entrepreneurship to be positively correlated. This is the case even
when accounting for our control factors of education, poverty, and
law/order.
In the future, yearly entrepreneurial activity
estimates will be needed for more countries in Africa. This way, a
longitudinal study that includes more datapoints can
be conducted. A study with more complete data would be able to determine
with more certainty if a significant correlation exists between trade openness
and entrepreneurial activity.
Also,
given our findings that Law and Order best explains
entrepreneurial activity in this dataset, it will certainly be worth studying
the relationship between these two factors in future as well.
Until more complete data is collected and
analyzed, no political or policy recommendations can be made to the leaders of
Africa regarding trade openness and entrepreneurship. This
being said, trade openness and entrepreneurship are both
known indicators of economic growth as discussed in detail in
the literature review portion of this report. Therefore, it would likely
be beneficial for African leaders to continue the push toward a more
globalized economic structure.
Appendix — Merged Data
|
Country |
Trade Openness (%) |
Entrepreneurship (%) |
Poverty (%) |
Education (Avg. Years) |
Law and Order (0-6) |
|
Angola |
66.37801194 |
40.84 |
10.7 |
4.94 |
2.5 |
|
Egypt |
48.27827106 |
9.84 |
1.2 |
7.45 |
3 |
|
Madagascar |
62.50180122 |
20.74 |
61.5 |
5.54 |
2.5 |
|
Morocco |
87.97578268 |
6.65 |
1.1 |
3.73 |
4 |
|
Sudan |
17.92676158 |
22.17 |
3.9 |
4.61 |
2.5 |
References
Adusei, M. (2016), Does Entrepreneurship Promote Economic Growth
in Africa?. African Development Review, 28: 201-214. https://doi.org/10.1111/1467-8268.12190
Bayar,
Y., Gavriletea, M., & Ucar,
Z. (2018). Financial Sector Development, Openness, and Entrepreneurship: Panel
Regression Analysis. Sustainability, 10(10), 3493. MDPI
AG. Retrieved from http://dx.doi.org/10.3390/su10103493
Bosma et al. (2020). Global Entrepreneurship
Monitor 2019/2020 Global Report. Global Entrepreneurship Research Association.
Brueckner, M. and Lederman, D. (2015), Trade Openness and Economic Growth:
Panel Data Evidence from Sub‐Saharan Africa. Economica,
82: 1302-1323. https://doi.org/10.1111/ecca.12160
Castellani, Francesca,
& Lora, Eduardo. (2014). Is Entrepreneurship a Channel
of Social Mobility in Latin America?. Latin American Journal
of Economics, 51(2), 179-194. https://dx.doi.org/10.7764/LAJE.51.2.179
Halkias, D., Nwajiuba, C., Harkiolakis, N. and Caracatsanis,
S.M. (2011), "Challenges facing women entrepreneurs in
Nigeria", Management Research Review, Vol. 34 No. 2, pp.
221-235. https://doi.org/10.1108/01409171111102821
Le
Goff, M. & Singh, R.J. (2013). Does Trade Reduce Poverty? A View
from Africa. Policy Research Working Paper 6327, The
World Bank, Poverty Reduction and Economic Management Unit. https://doi.org/10.1596/1813-9450-6327
Nafukho,
F.M. and Helen
Muyia, M.A. (2010), "Entrepreneurship and socioeconomic
development in Africa: a reality or myth?", Journal of
European Industrial Training, Vol. 34 No. 2, pp. 96-109. https://doi.org/10.1108/03090591011023961
Singh,
G. and Belwal, R. (2008), "Entrepreneurship
and SMEs in Ethiopia: Evaluating the role, prospects and problems faced by
women in this emergent sector", Gender in Management, Vol. 23 No. 2, pp.
120-136.
Spilimbergo, A., Londoño J.L.,
Székely, M. (1999), Income distribution,
factor endowments, and trade openness, Journal of Development Economics, Volume
59, Issue 1, pp. 77-101, ISSN 0304-3878. https://doi.org/10.1016/S0304-3878(99)00006-1.
Appendices
Jhaelle and Eric split the final report. Jhaelle wrote the Results,
Methods and Keywords section. Eric wrote the Abstract, Introduction, Literature
Review, Discussion and Limitations, and Significance, Future Study,
Policy Recommendations sections. Jhaelle also helped with a portion of the
Literature Review and Discussion and Limitations sections. Jhaelle created
Figures 1-6, and Eric created Table 1 and the Appendix. Eric sourced and
compiled the data, and Jhaelle created the linear regression model.